Gilbert, Arizona has seen remarkable growth over the years. According to U.S. Census bureau data, between 2000 and 2010, the population of Gilbert almost doubled, making it the the fastest-growing large city in the country.
(Side note: Because Census data is only collected every 10 years, we have supplemented it with data from the Maricopa Association of Governments. Population measurements like these are often estimates, so there may be slight variance.)
In this graphic, we see a steady growth trend — a sure sign of a healthy town. Once Gilbert reaches full build out, it is expected to have over 350,000 residents!
The data set we’re looking at is the Full-Time Employee count for the Town. Although most municipalities hire part-time employees also, the full-time employee count is the one that’s useful to us because it records the permanent employees that are required for major services and best shows the growth of the government. This data set is divided up by year and department so we can add up all the counts for each department to get the yearly totals.
Now, if we look at the total full-time employees per year, we get a trend line that looks like this:
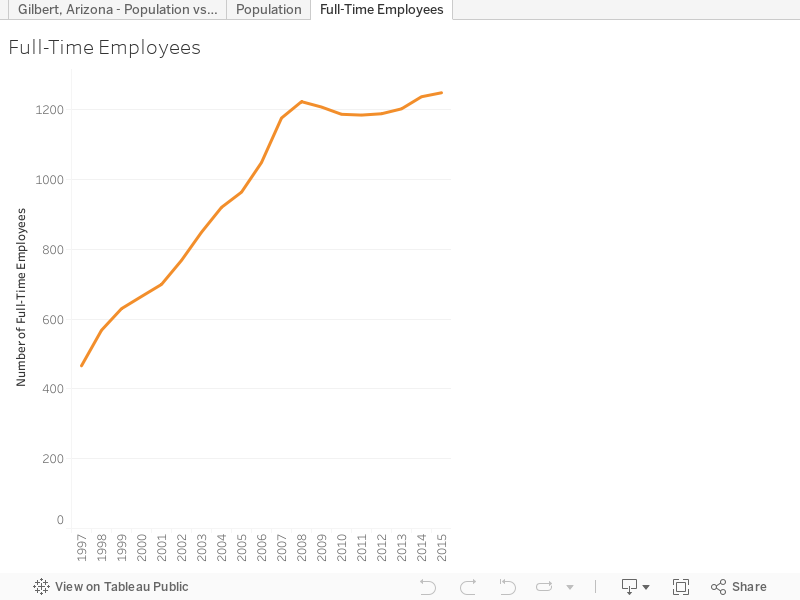
Right away, we can see that there seems to be a similar increase just before 2010 but then things seem to level off. Let’s take a look at the charts stacked on top of each other and see how they compare.
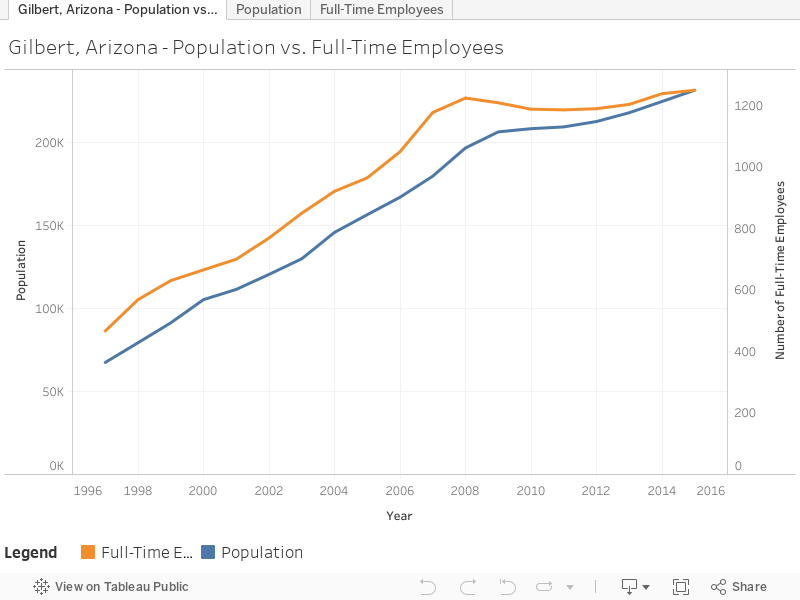
To show this chart, we’ve taken the data sets and stacked them on top of each other with the Full-Time Employee data set scaled to match the Population data set. As you can see, the number of full-time employees corresponds pretty closely with the overall growth of Gilbert!
So what does this mean? How does this compare with other municipalities?
Even though Gilbert is growing very quickly, most residents will still say that Gilbert has a small-town feel to it and that it doesn’t feel like a city at all. If we take this data and average out the latest numbers, Gilbert has nearly 200 residents for every full-time employee working in the Town’s government. This means Gilbert has an especially high employee-to-resident ratio.
| City Name | Population (U.S. Census Bureau, 2024) | Full-Time Employees (ASPEP, 2024) | Residents Per Employee |
| Gilbert, Arizona | 288,790 | 1,533 | 188.38 |
| Boise, Idaho | 237,963 | 1,724 | 138.03 |
| Plano, Texas | 293,286 | 2,371 | 123.70 |
| Lincoln, Nebraska | 300,619 | 2,634 | 114.13 |
| Madison, Wisconsin | 285,300 | 2,673 | 106.73 |
This doesn’t tell the full picture, though. Some places need additional employees for services that don’t exist in Arizona. After all, we don’t plow much snow in Gilbert! Let’s take a look at how Gilbert compares to other cities in the Valley.
| City Name | Population (U.S. Census Bureau, 2024) | Full-Time Employees (ASPEP, 2024) | Residents Per Employee |
| Gilbert | 288,790 | 1,533 | 188.38 |
| Chandler | 281,231 | 1,739 | 161.72 |
| Queen Creek | 83,781 | 521 | 160.81 |
| Peoria | 199,924 | 1,302 | 153.55 |
| Tempe | 190,114 | 1,830 | 103.89 |
As we see both in and out of the Valley, Gilbert has a leaner government than many of its peers.
As Gilbert continues to grow, it is important to look at what services the government is providing while keeping costs and taxes for residents down. As new services and technology provide innovative avenues for service and resident engagement, it will be important to see how the number of employees change with the population growth. Some services will require the Town to hire more employees but others may allow the Town to consolidate and offer more services with the same staff.
It is exciting to imagine where the future of Gilbert will take us! Thanks for coming along to learn more!
![]() Growth and Development
Growth and Development
![]() Finance and Operations
Finance and Operations
Alex, where can I find information about what is being built at a certain location?
Hi, Marty! Sorry for the delayed response. Although I don’t have the data specifically for what’s being built at specific locations around the Town yet, I do have a link that might help you get that information. Here’s a mapping tool of all the Planning and Zoning cases for specific parcels in Gilbert. If you click on each point, you won’t see exactly what’s being built there but you’ll at least see a summary of the type of development or plan for that area. I hope that helps!!